
Multivariate Data Analysis and Visualization Through Network Mapping
Recently I had the pleasure of speaking about one of my favorite topics, Network Mapping. This is a continuation of a general theme I’ve previously discussed and involves the merger of statistical and multivariate data analysis results with a network.
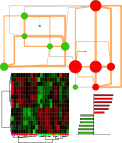
Over the past year I’ve been working on two major tools, DeviumWeb and MetaMapR, which aid the process of biological data (metabolomic) network mapping.

DeviumWeb– is a shiny based GUI written in R which is useful for:
- data manipulation, transformation and visualization
- statistical analysis (hypothesis testing, FDR, power analysis, correlations, etc)
- clustering (heiarchical, TODO: k-means, SOM, distribution)
- principal components analysis (PCA)
- orthogonal partial least squares multivariate modeling (O-/PLS/-DA)

MetaMapR– is also a shiny based GUI written in R which is useful for calculation and visualization of various networks including:
- biochemical
- structural similarity
- mass spectral similarity
- correlation
Both of theses projects are under development, and my ultimate goal is to design a one-stop-shop ecosystem for network mapping.
In addition to network mapping,the video above and presentation below also discuss normalization schemes for longitudinal data and genomic, proteomic and metabolomic functional analysis both on a pathway and global level.
As always happy network mapping!


Hello — Thank you for posting about DeviumWeb (and your work) on r-bloggers! I’ve successfully installed DeviumWeb (and its many dependencies), but I get an ambiguous error:
“Error in function (type, msg, asError = TRUE) : couldn’t connect to host”
that prevents DeviumWeb from starting. Any idea what would be causing this? Very excited to try this out!
July 2, 2014 at 5:06 pm
Hi,
This is my fault, I forgot to turn off scripts used for development. I just updated and hopefully things will work now.
Also, it has been a while since last update of DeviumWeb (winter 2014), and somethings may have broken. I will push new version in early September 2014, which should have all of theses fixed and more functionality added. In the mean time if you catch “mission critical” errors feel free to post on the DeviumWeb issues page ,and I will try to address them.
July 2, 2014 at 6:11 pm
I’m still getting the same error, but the version on Sourceforge works fine. Will look forward to future updates. Thanks again for your efforts!
July 2, 2014 at 7:22 pm
Hi,
Thanks for giving a smart shiny app for Multivariate Data Analysis and Visualization Through Network Mapping.
I have installed all dependencies which is required as you instructed using RStudio, but at last i got an error in “DeviumWeb” as given below
Listening on http://127.0.0.1:3033
Error in bsAlert(inputId = “DATA_anchor”) :
unused argument (inputId = “DATA_anchor”)
What is it mean, hown i resolve/debug this problem
I have a dataset of GCMS of Ginger’s Sample and i need to analyse it using your apps.
April 8, 2015 at 12:14 pm
Hi,
This looks like a bug (https://imdevsoftware.wordpress.com/2015/04/09/o-pls-example-and-trial-server/). I’ll try to patch this next update. In the mean time try to make sure that shinyBS package is correctly installed. Additionally this is an alert about missing data. Impute the missing data with some value prior to upload and you should not encounter this issue.
April 8, 2015 at 10:48 pm
This issue should now be fixed.
April 13, 2015 at 10:46 pm